


Talk to Us
Schedule a quick meeting with one of our experts.


In the dynamic landscape of cloud computing, organizations leveraging AWS services often face challenges in analyzing and managing costs efficiently. As businesses grow, the complexity of AWS resources and bills increases, making it difficult to track the utilization of cloud resources, necessitating a strategic approach to cost analysis.
Enterprises grappling with dynamic growth and inadequate planning encounter significant challenges in AWS cost analysis, hindering effective financial optimization and beyond. The typical being:
Leveraging AWS’s well-architected Labs enhances Cloud Financial Management. It offers solution to the challenges through the Cloud Intelligence Dashboard. Organizations can create a powerful and flexible cost analysis platform by leveraging serverless services like Amazon S3, AWS Glue, Amazon Athena, and Amazon QuickSight.
AWS Cost and Usage Report (CUR) provides comprehensive data about your AWS costs, including information related to product, pricing, and usage. By including the Resource IDs and choosing hourly time granularity, CUR allows you to analyze your costs in greater detail and accuracy.
In pursuit of strategic financial governance in the cloud, the implementation of a Cloud Intelligence Dashboard aligns with key business objectives, including the building of a centralized dashboard for all management (payer) accounts, enabling real-time dynamic updates for actionable insights, facilitating user-defined cost allocation tags to enhance analysis, and seamless customization for the effortless inclusion of new accounts into the dashboard.
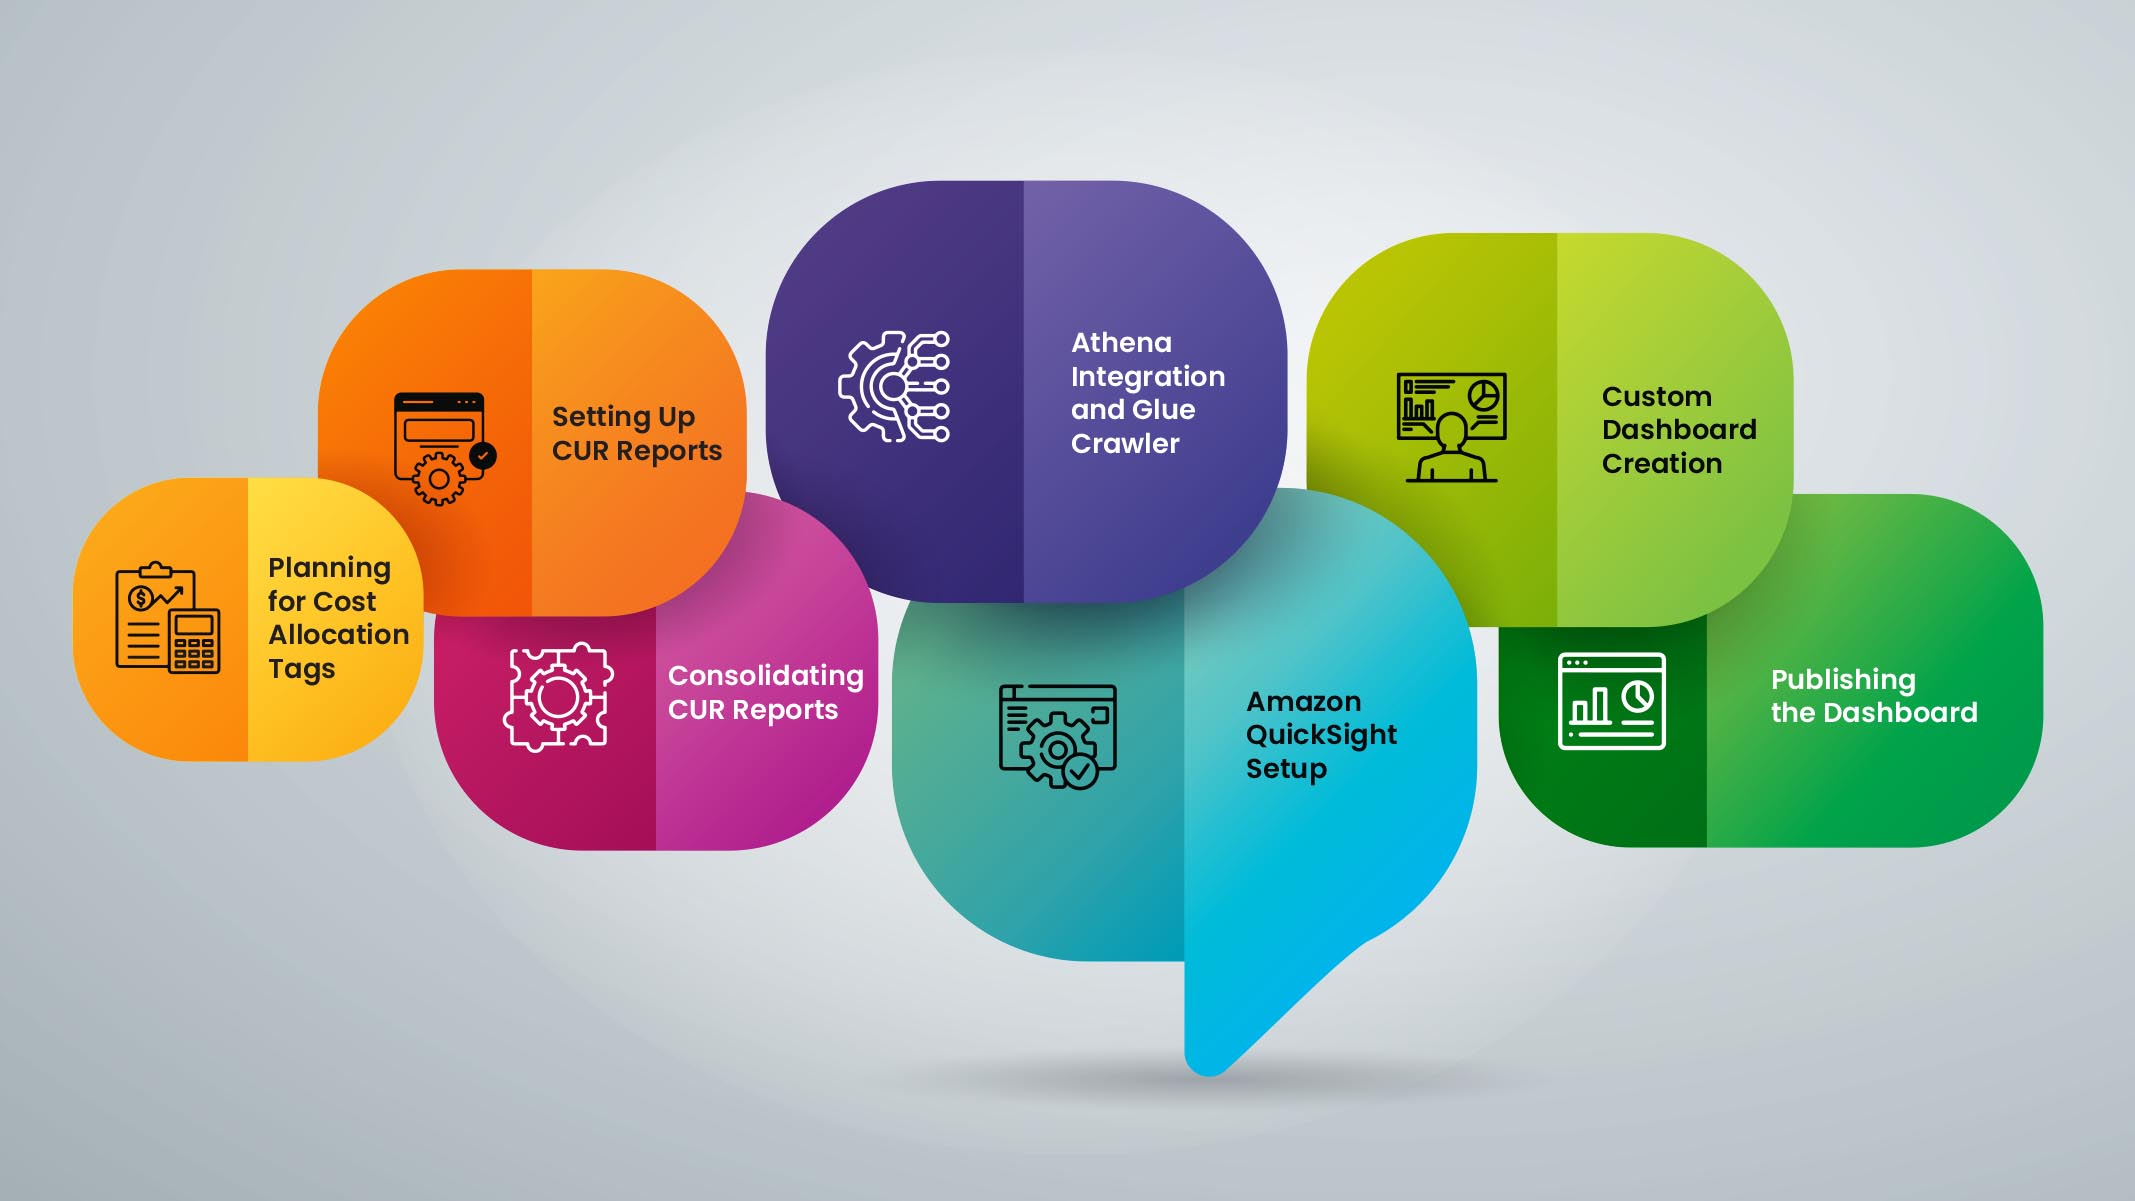
Solution Approach and Implementation:
Deployment of an AWS Well-Architecture LAB of CID (Cloud Intelligence Dashboard) and creation of a Custom Dashboard for Cost Analysis requires broader steps as part of the solution implementation, viz.
In response to the evolving landscape of cloud utilization, undertaking a comprehensive approach to AWS cost management, with a dynamic dashboard solution effectively addresses challenges yielding impactful outcomes. This strategic implementation encompasses both technological advancements and tangible business results, positioning the organization for greater efficiency and financial optimization in the cloud environment.
Custom script for replication of the CUR reports from multiple payer account make it easy to add any new account and centralize data for creating a dataset for the dashboard.
Using Athena and Crawler service makes it easy for the data to be updated dynamically on schedule.
With QuickSight, creating and updating visuals for analysis becomes effortless, enabling seamless sharing of dashboards across diverse users and incorporating the convenience of scheduling custom reports to be delivered to any email.
The Business Outcomes include:
Visualization and Insights: The deployment of the dashboard makes the visualization of the cost expenditure much easier and simpler using AWS QuickSight, where data is represented using visual and trend charts.
Trend Analysis: It provides clear visibility for the application owner, Infrastructure team, and financial team to better understand the cost spent over the months for each service and application and identify the area of optimization of resources.
Granularity: With Filters added for Billing Period, Application, Top N application/ Resources, Services, etc. on the dashboard, it is possible to do a more granular analysis month-wise, application-wise, service, etc., which provides greater insights.
To conclude, the implementation of a Cloud Intelligence Dashboard using AWS Well-Architected labs transforms cost analysis into a seamless and efficient process. Organizations can now gain a comprehensive view of their AWS costs, identify optimization opportunities, and make informed decisions for better resource allocation. The dynamic and user-friendly nature of the dashboard ensures that businesses can adapt to evolving cost management needs in the ever-changing cloud environment.
